Every outbound leader has sat in a pipeline review where the number on the screen was already history. Meetings booked last month, revenue closed last quarter, win rate for a cohort that started ramping in the spring. You can explain those numbers. You cannot change them. By the time a lagging indicator turns red, the decisions that caused it were made weeks earlier.
The teams that hit target consistently are not smarter about their lagging numbers. They are disciplined about the leading ones: the small, controllable inputs that predict the outcome while there is still time to act. This post breaks down the difference, gives you a working set of leading indicators for outbound, and shows how to build a scoreboard that catches problems in days instead of quarters.
The core distinction
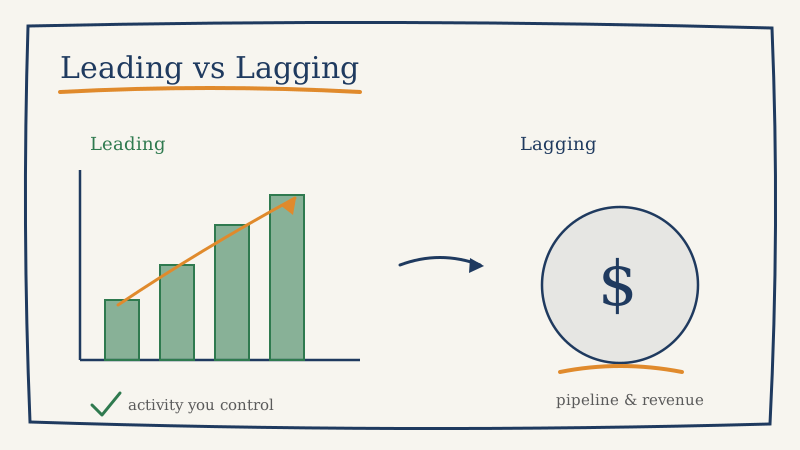
A lagging indicator measures a result after it has happened. Pipeline created, meetings held, opportunities won, revenue booked. These are the numbers your board cares about, and they are real, but they are rear-view mirrors. You report them; you do not move them directly.
A leading indicator measures an input that happens before the result and correlates with it. Dials made, quality emails sent, reply rate, connect rate, meetings booked per hundred contacts. You can change these today, and if the correlation holds, tomorrow’s lagging number moves with them.
The trap most teams fall into is managing exclusively on lagging indicators because they are the ones tied to comp and forecast. That is like driving by watching the odometer. The odometer tells you where you have been. It says nothing about the turn you are about to miss.
A working set of leading indicators for outbound
Not every activity metric is a good leading indicator. A good one has three properties: it is controllable (the rep can change it), it is countable (you can measure it without a debate), and it is correlated (it actually predicts the outcome you care about). Volume of low-quality activity fails the third test, which is why “emails sent” on its own is a vanity number.
Here is a layered set that respects all three tests, moving from top of funnel to booked meeting.
Layer 1: Volume and coverage
- Contacts touched per day across every channel, not just email. If a rep touched forty accounts but only over one channel, coverage is thinner than the raw number suggests.
- Accounts with a complete multi-touch sequence versus accounts that got a single email and went quiet. Single-touch coverage is the most common silent killer of outbound pipeline.
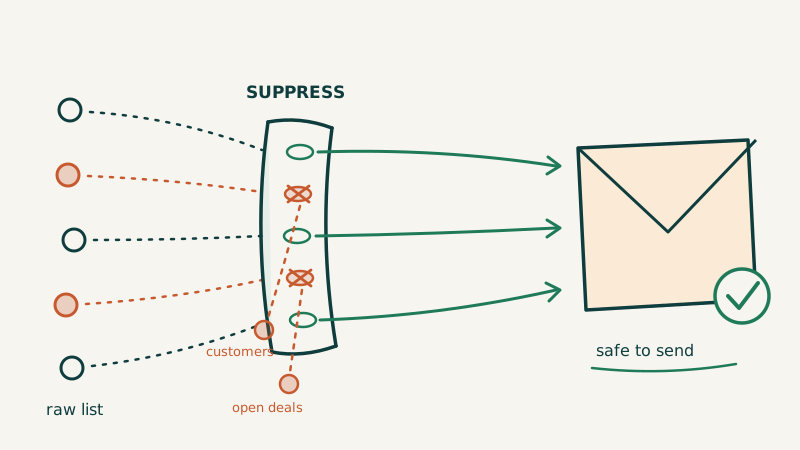
- List freshness: percentage of contacts verified and deliverable at send time. Bounce rate is a lagging symptom; verified-at-send is the leading input. Cleaning your list with a validation layer like Scrubby before a send is the difference between reaching the inbox and quietly torching your sender reputation.
Layer 2: Engagement quality
- Reply rate, split into positive, neutral, and negative. Positive reply rate is one of the earliest honest signals that your message and targeting are landing.
- Connect rate on calls and accept rate on LinkedIn requests. These tell you whether your list and your first line of contact are even viable before you invest sequence effort.
- Open-adjusted reply rate where you can trust opens. Treat opens with suspicion (privacy features inflate them), but a reply rate that moves independently of opens is signal you can act on.
Layer 3: Conversion into the funnel
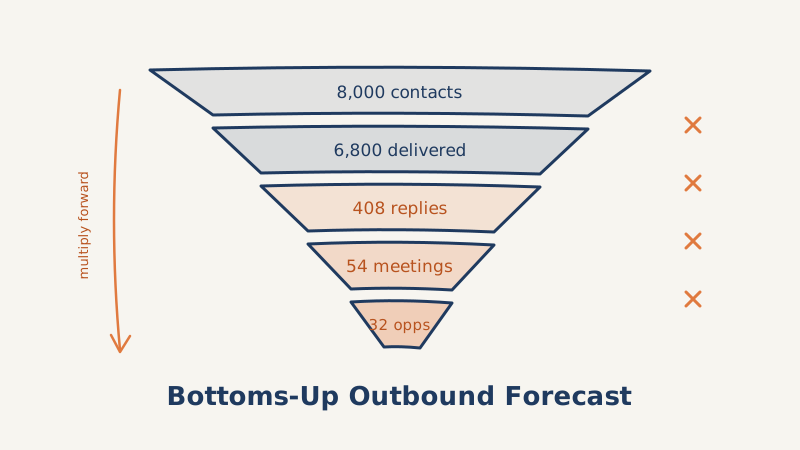
- Meetings booked per hundred contacts by segment. This is the tightest leading indicator for next month’s held-meeting number.
- Meeting-to-held rate, which surfaces a no-show problem while you can still fix the confirmation process rather than after the quarter closes. Sending calendar-native invites through a tool like Kali instead of a plain booking link is one of the fastest levers on this exact metric.
- Sequence completion rate: how many prospects reach the end of the cadence versus stalling halfway. A cadence that dies at step three is leaking meetings you already paid to source.
How to tell if an indicator is truly leading
The honest test is a lag correlation, not a hunch. Take a leading candidate (say, meetings booked per hundred contacts) and plot it against the lagging outcome it should predict (held meetings, then pipeline) two to six weeks later. If the leading metric rises and the lagging metric reliably rises after it, you have a real predictor. If they move independently, you have a vanity number dressed up as insight.
Run this check per segment, because a leading indicator that predicts well for mid-market can be noise for enterprise, where cycles are longer and single-threaded sourcing behaves differently. When you find a leading metric with a stable lag relationship, it becomes the thing you manage weekly. When you cannot find the relationship, stop reporting the metric; it is costing attention and buying nothing.
Build the scoreboard around cadence, not just the number
Leading indicators only pay off if you look at them on a cadence short enough to act. A lagging pipeline number reviewed monthly is fine. A leading reply-rate drop reviewed monthly is malpractice, because you have already burned four weeks of sends on a broken message.
A practical rhythm looks like this:
- Daily: volume and coverage. Are reps touching enough accounts across enough channels, with a fresh list? A missed day here is cheap to fix today and expensive to fix in the pipeline review.
- Weekly: engagement quality and meetings booked per hundred. This is where you catch a messaging or targeting problem while it is still a messaging problem and not yet a pipeline hole.
- Monthly and quarterly: the lagging outcomes. Held meetings, pipeline created, win rate, revenue. Report them, forecast on them, but do not try to manage them. By this cadence they are already set.
The point is to match the review frequency to how early the metric moves. Leading indicators earn their name only when you look at them early enough to steer.
Where outbound teams get this wrong
Three failure patterns show up again and again.
Comping on volume alone. When reps are measured purely on activity count, they optimize for the count and quality collapses. Volume is a leading indicator only when paired with a quality gate like positive reply rate. Track them together or the volume number lies to you.
Confusing a lagging metric for a leading one. “Pipeline created” feels like something you can push on, but it is an outcome. The leading inputs are the contacts, the coverage, the reply rate, and the meetings booked that produce that pipeline. Push on the inputs; the pipeline follows.
Reviewing everything on the same cadence. If your only ritual is a monthly number review, every metric effectively becomes lagging, because a month is long enough for any input problem to already show up in the output. Split the cadence. Daily for inputs, weekly for engagement, monthly for outcomes.
The infrastructure question underneath the metrics
None of this works if you cannot trust the underlying data. Reply rate is meaningless if half your sends bounce before anyone reads them. Meetings-booked is noise if invites vanish into spam. Coverage is a fiction if your list decays faster than you refresh it. The leading-indicator discipline sits on top of clean sending infrastructure, verified lists, and reliable booking. That is exactly the layer an outsourced outbound partner is supposed to own end to end, so your team can watch the leading numbers instead of firefighting deliverability. If you are weighing whether to build that instrumentation in-house or buy it, Vendisys runs the full outbound engine (data, sending, and booking) as managed infrastructure, which means the leading indicators above come instrumented rather than improvised.
The one-line version
Manage the inputs you can change this week, report the outcomes you cannot. Leading indicators are where the steering happens. Lagging indicators are where you keep score. Confuse the two and you will spend every quarter explaining a number you could have moved a month ago.
Pick three leading indicators that pass the controllable, countable, correlated test, put them on a daily-and-weekly cadence, and watch the lagging pipeline number stop surprising you.